NetPath™
If an IT guy gets complaint like “Hey, Jira is slow today!” then NetPath™ is the product he is going to use for find out what is going on.
Problem definition
Hybrid IT environments are changing the game. Today’s services are moving to the cloud. The infrastructure is provided by external providers such as Amazon AWS or Microsoft Azure but the internal administrators are still being responsible for the performance of these services. Traceroute is the only way of monitoring network paths, but once leaves the internal network, there is no visibility of hop-by-hop performance. Does not continuously monitor and usually gets blocked by firewall. See the following short video (1:12 min) explaining the Hybrid IT visibility problem.
My role
Lead UX and UI designer. I led this project since the technology proof-of-concept phase. I closely cooperated with PM on materializing his vision into initial wireframes, and UX Researcher on validating the designs with users. I also created high-fidelity interactive prototype used for usability research. Once project was in a good shape, and all the main UIs and flows were designed and validated with users, I transitioned to another high-priority project and my colleague Monika did a tremendous job on finalizing all the implementation-specific details for the scrum team.
Project overview
Manage Service Monitors provides a list of all monitored network paths and allows for administration operations. Getting started wizard gets user up and running with fully configured multi-service dashboard. The actual Service-, Source- and Path-Details pages allows for detailed service performance and history investigation.
Step 1: Initial sketches and concepts
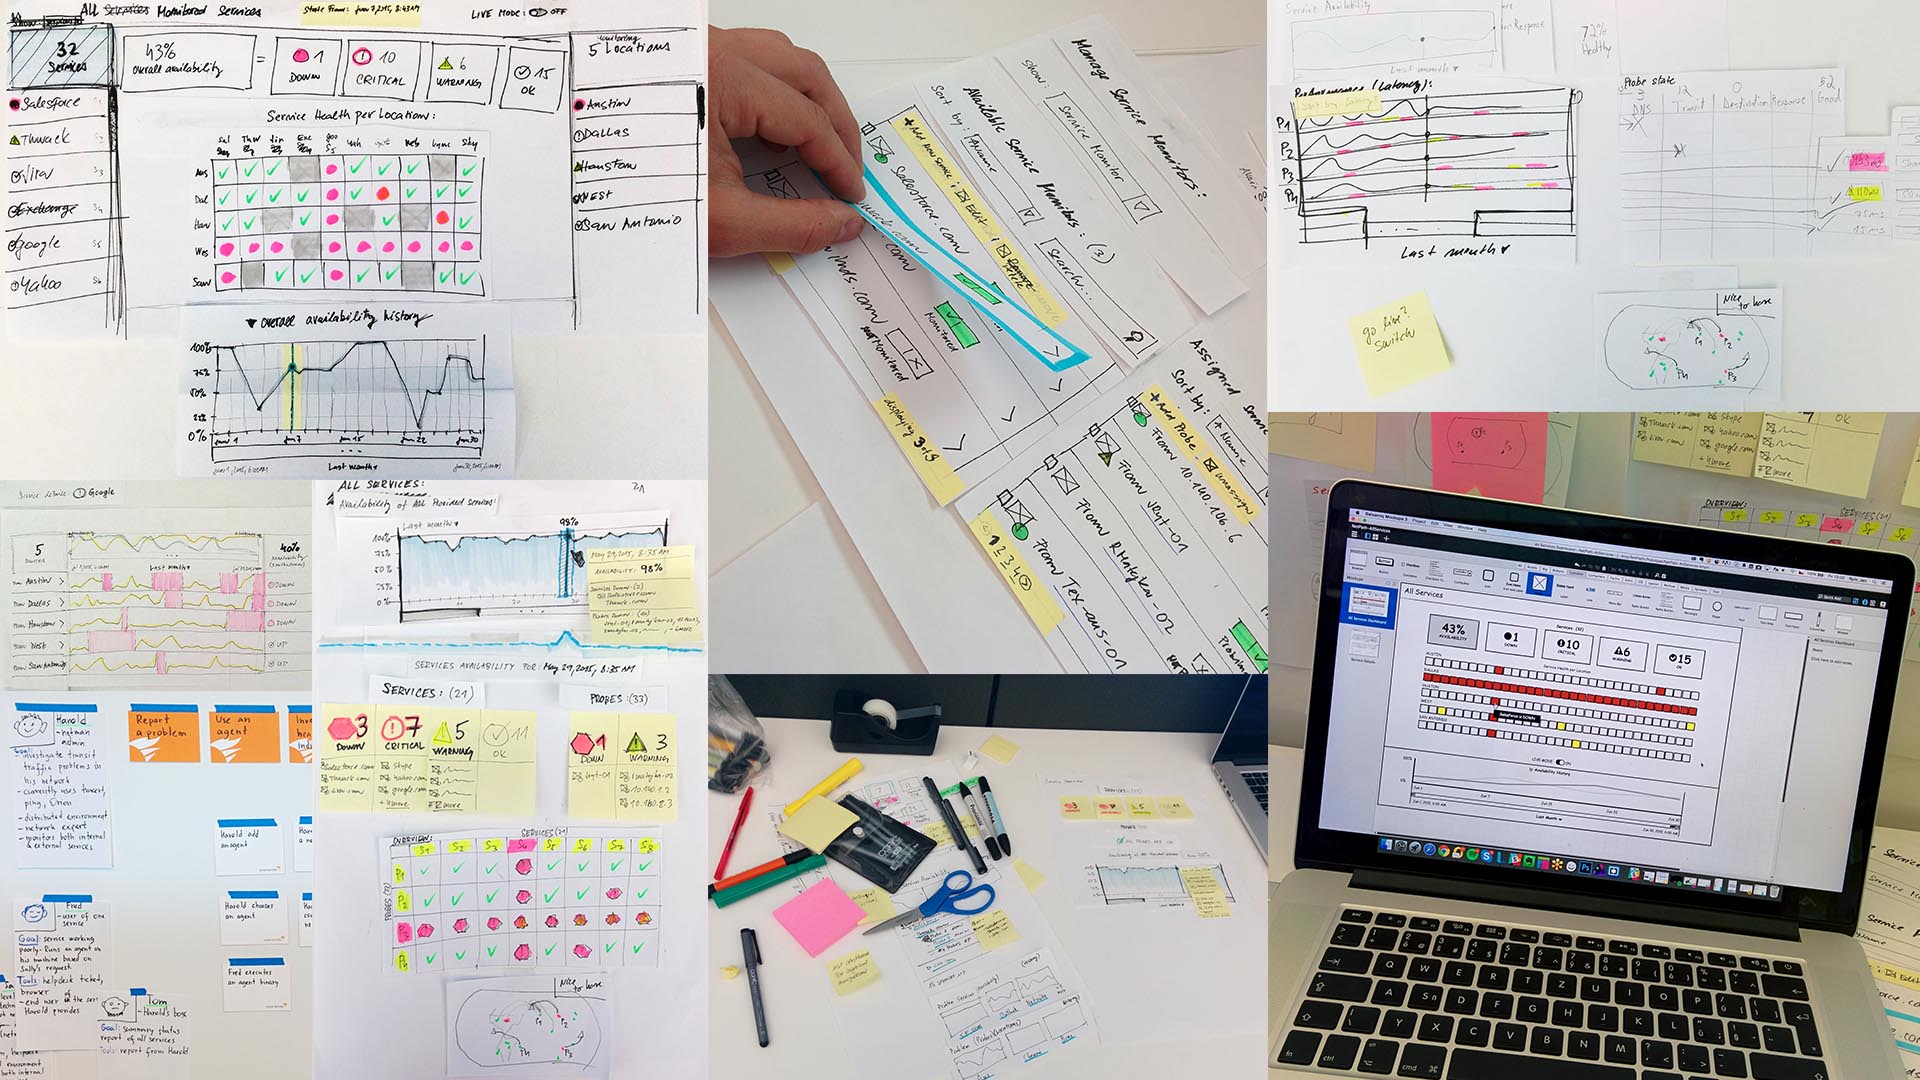
We closely cooperated with product manager on coming up with the sketches of his vision. We sketched out the whole flow and then iterated on specific screens. Paper prototyping helped us quickly investigate various approaches and discuss them with the whole team.
Step 2: Usefulness validation
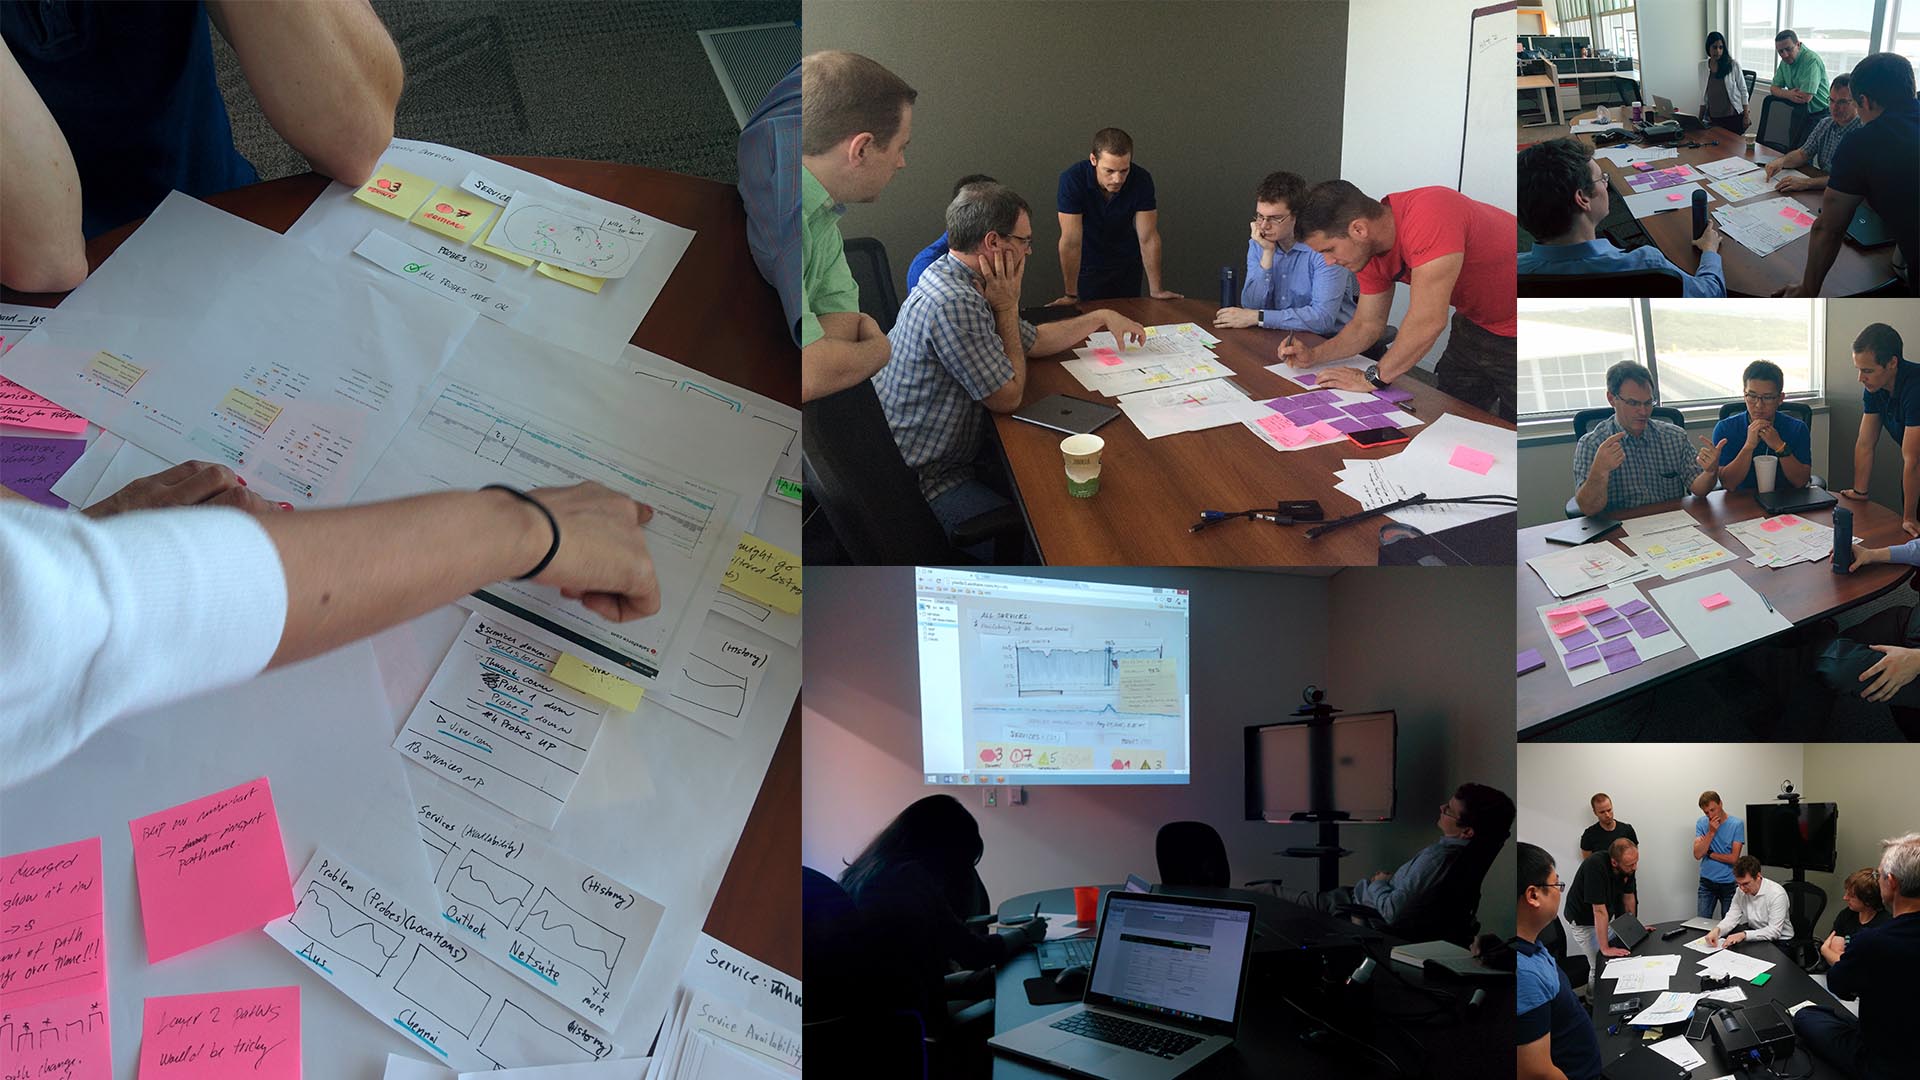
We validated the usefulness of the initial designs with internal IT guys and later with actual users via remote sessions. We took photos of our sketched-out flows and created click-through prototype in Axure that we showed to users and let them walk through and provide us with feedback on usefulness of this project.
Step 3: Digital wireframes and mockups
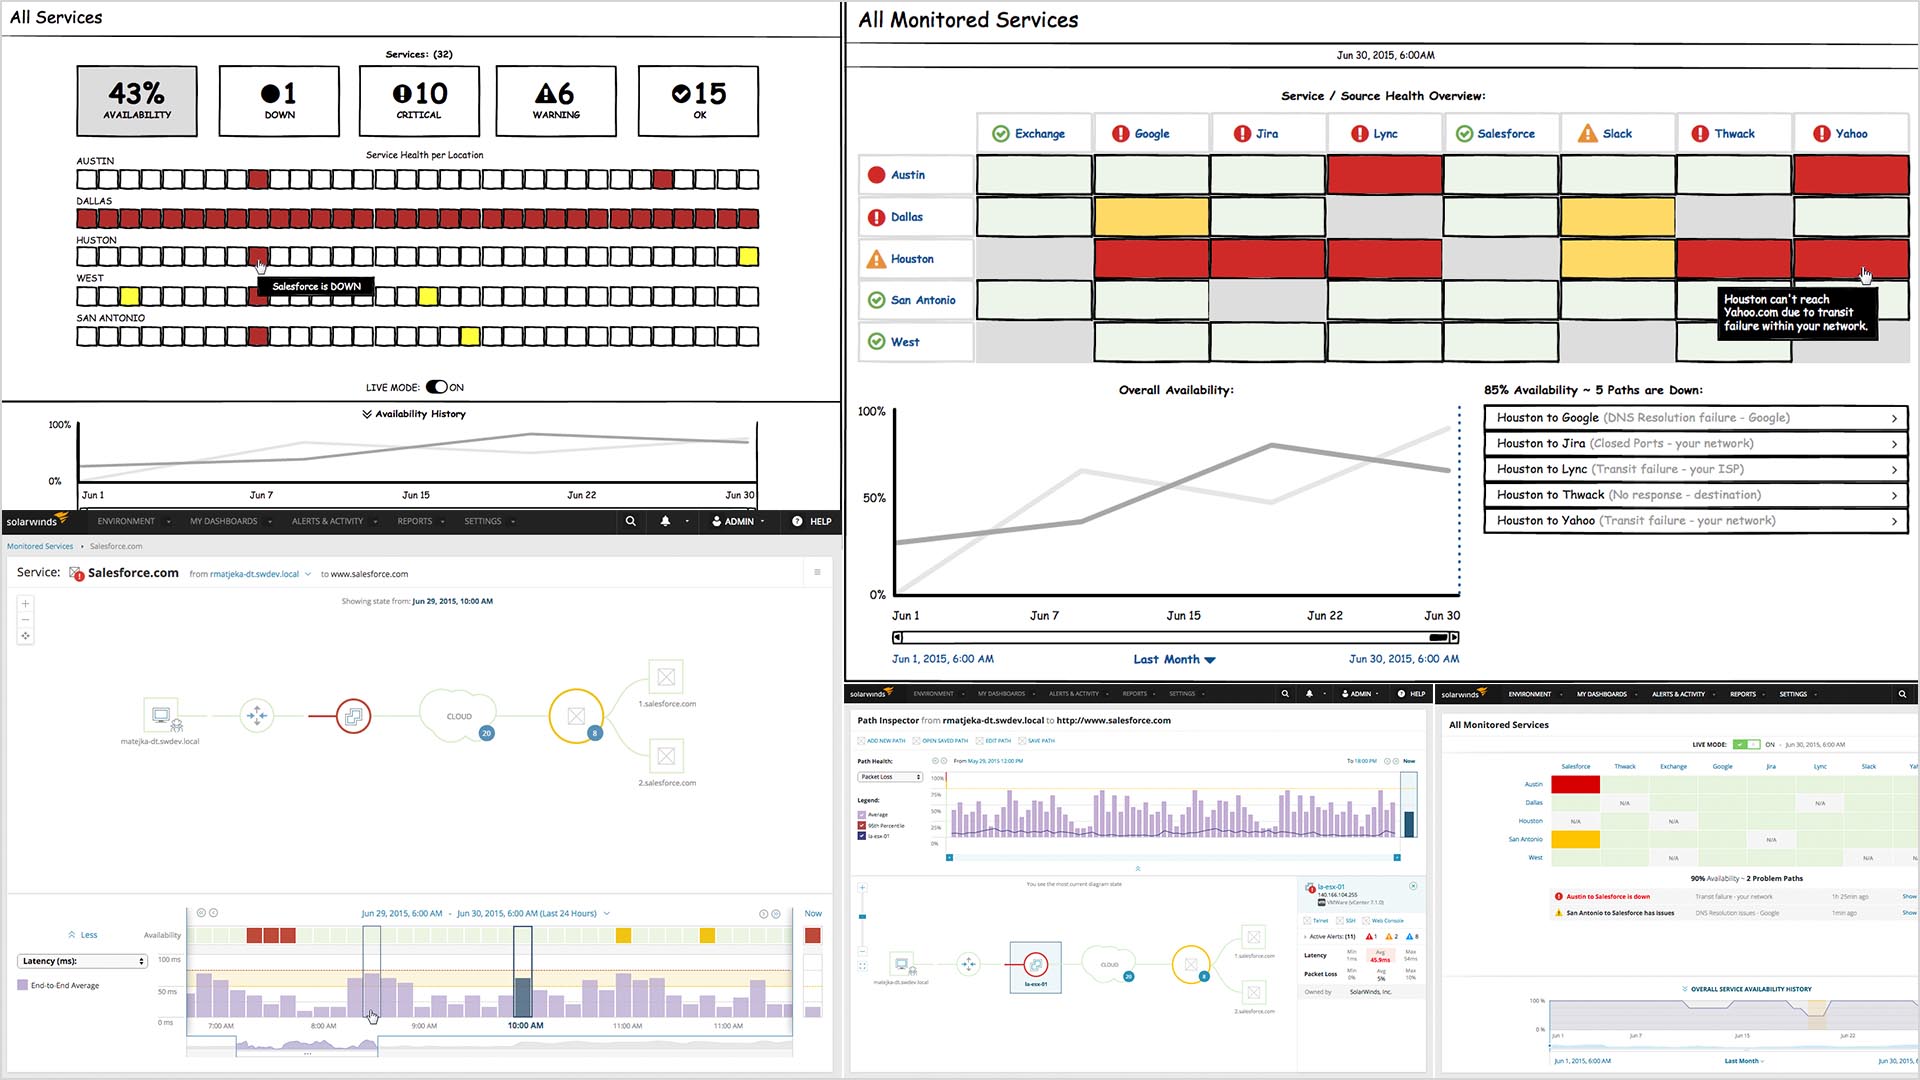
Once we knew we are on the right track, we moved to higher fidelity digital mockups, elaborated more on details of the individual screens, regularly discussed and iterated on design. Here are only few examples of rough digital wireframes. There was so many other screens and variations.
Step 4: Interactive prototype, usability research
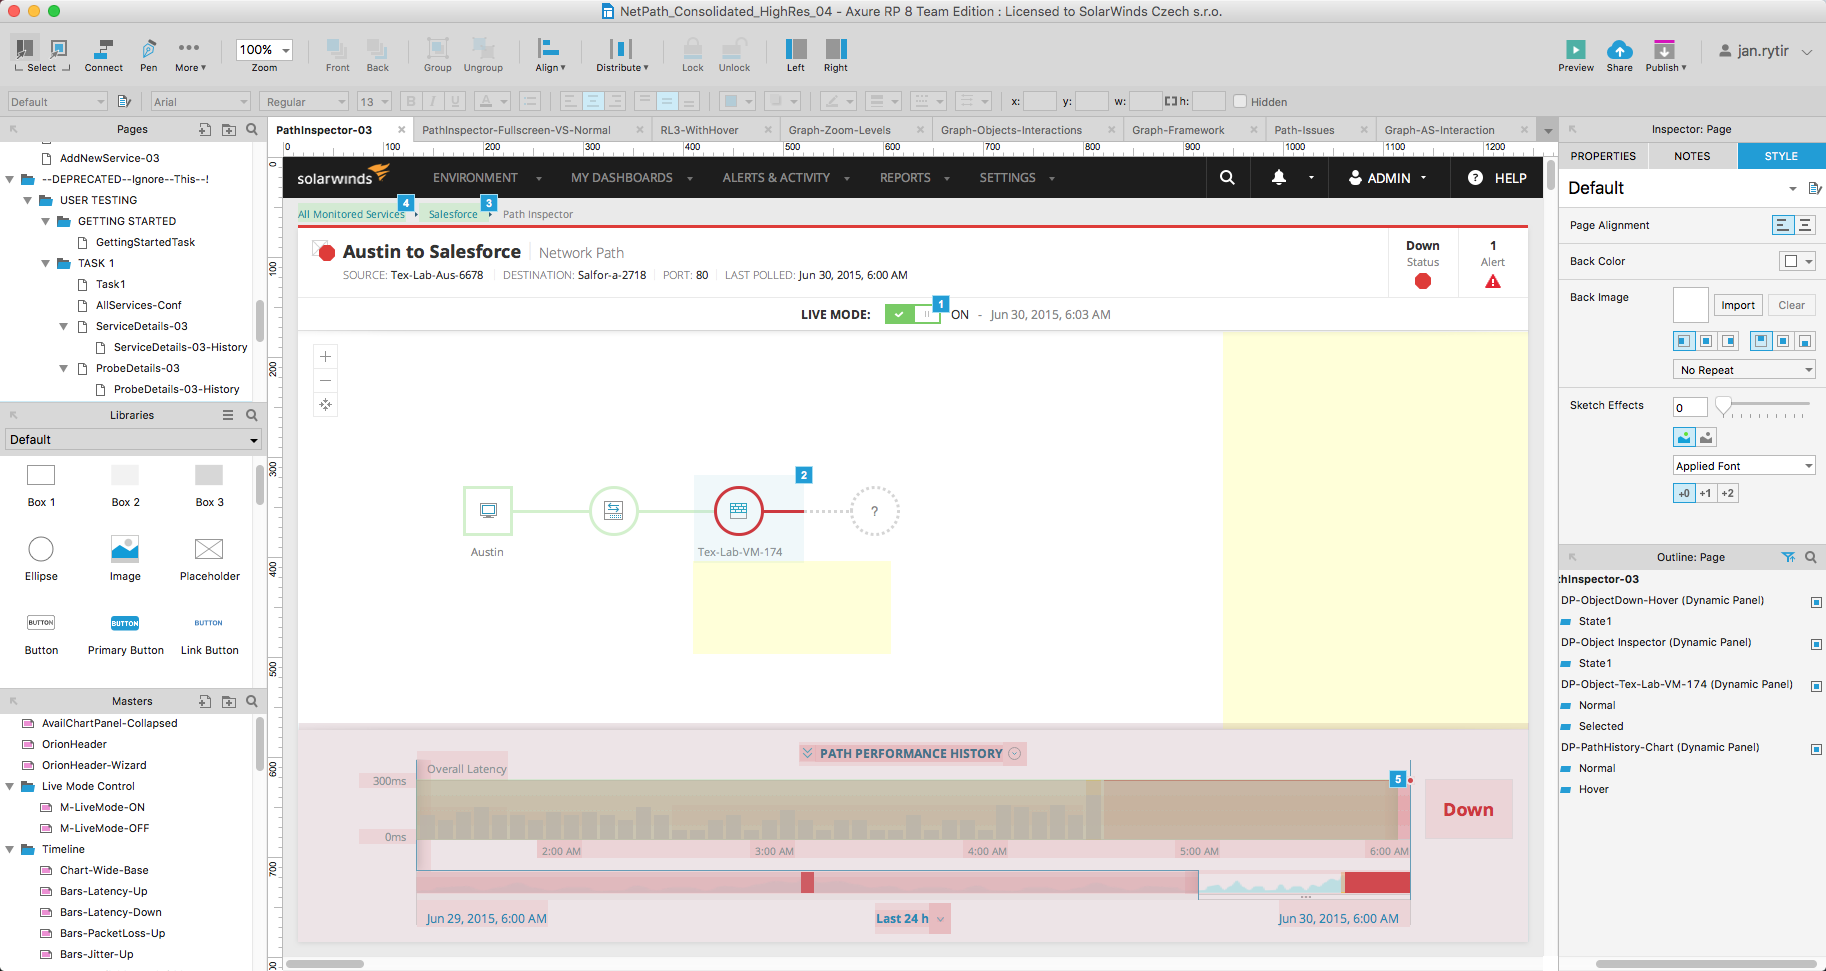
As we had more details finalized, we created a realistic looking semi-interactive prototype that we used for task-based usability walkthroughs with users. At this point we tested the usability - if they understand the UI and how everything flows and works.
Step 5: Final design
Final product design consists of Getting started wizard, couple configuration dialogs, service environment overview, service detail, probe detail, the actual network path inspector, network path graph and it´s interactions, details popovers and panels various information detail density modes, service and probe management screens so it resulted as pretty solid and extensive project. But because this was 1.0 project release, only some parts of it ended up being shipped to customers.
The shipped result
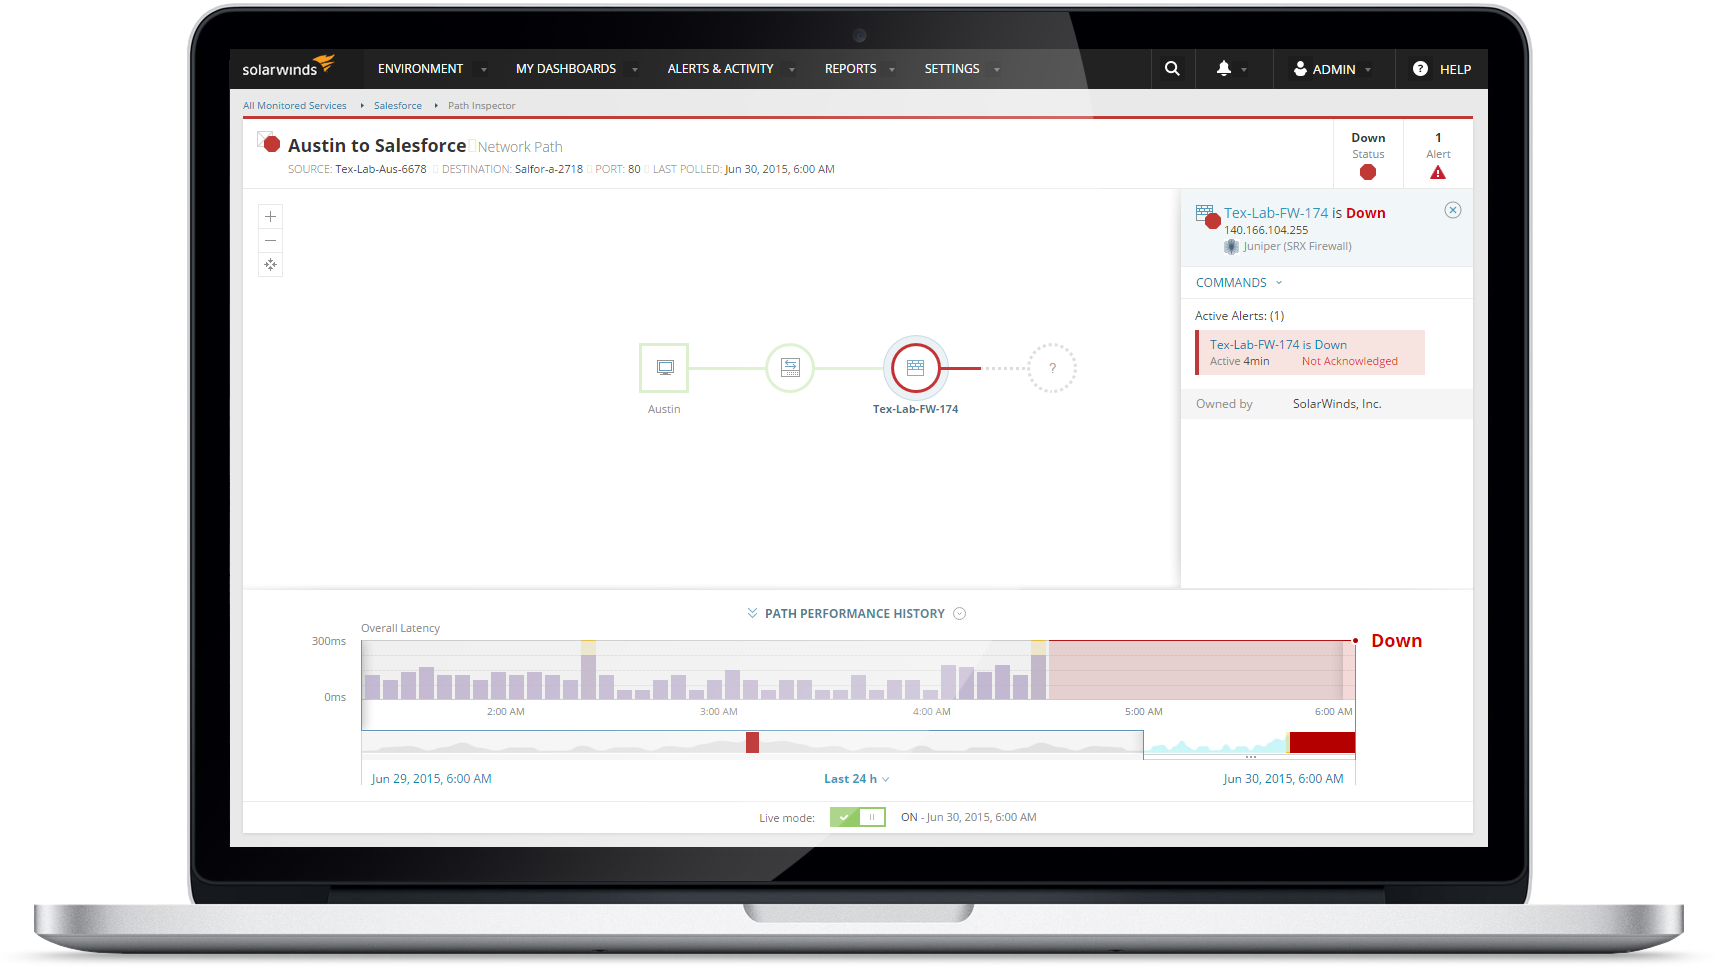
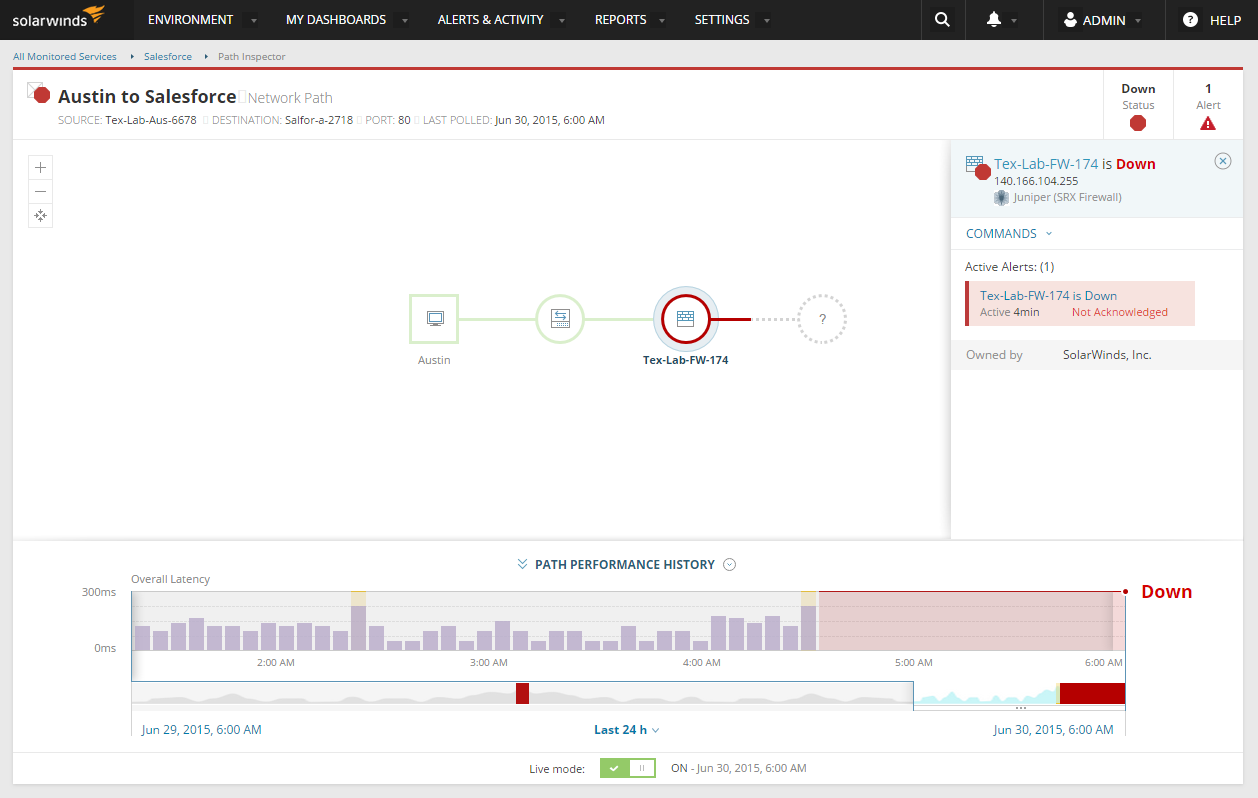
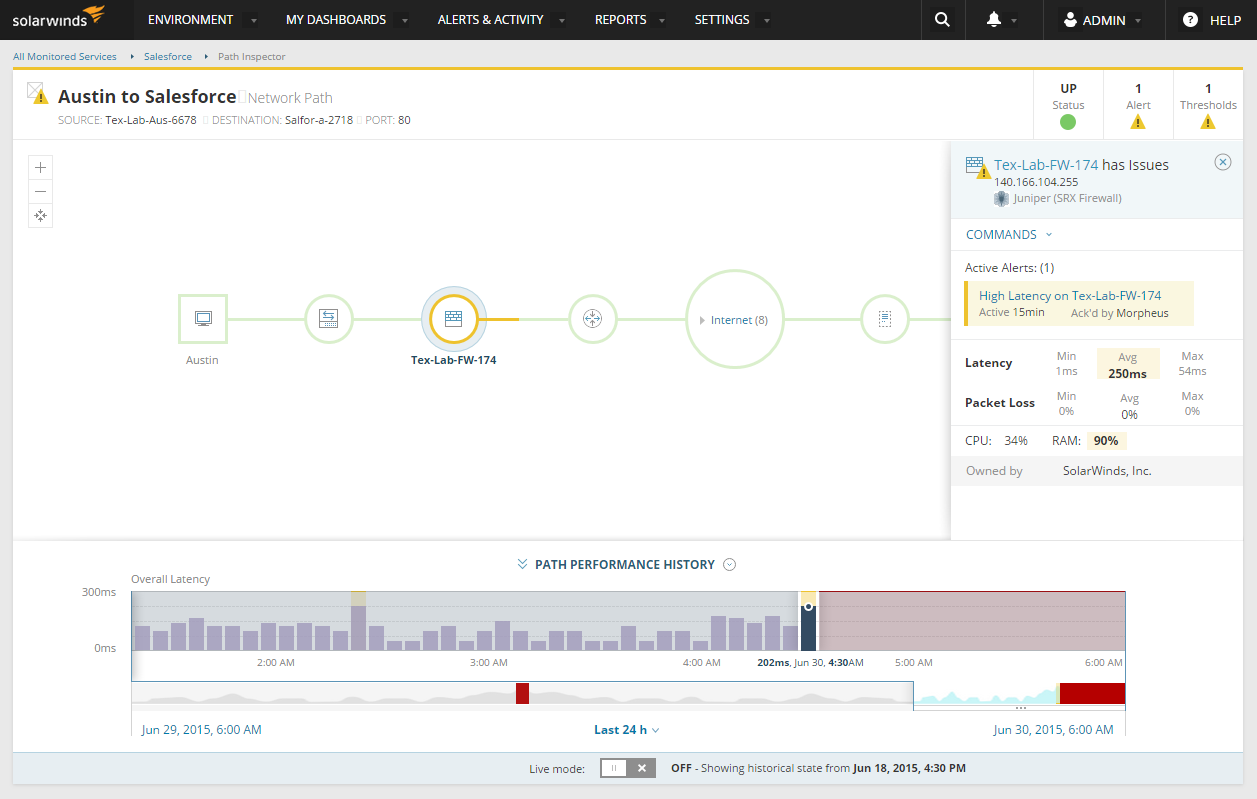
NetPath is a brand new (1.0) functionality of Network Performance Monitor, that allows administrators to troubleshoot today’s complex hybrid IT networks by discovering, visualizing and analyzing the dynamic network paths from source to destination and all the hops in between including the internet portion of the path.
Visualizing the cloud path
Visualizing and analyzing the cloud (internet) portion of network path is the game-changing functionality. Being able to to inspect carrier’s networks and assist the actual ISP’s helpdesk with troubleshooting their own network is huge benefit.
Recognizing the root cause
Netpath continuously monitors these complex, multi-path networks, keeps track of past results, determines infrastructure within the path, evaluates where the traffic slowdowns are occurring, provides additional data only when it relates to the real problem, alerts on significant changes and allows to travel back in time to compare the changes and diagnose what was happening.
Company context for this project
We already had a skilled UI developers. The portion of the new SolarWinds UI framework was already available to product teams. Business saw the need for high quality UI implementation and delightful user experience.
Interested in even more details?
See NetPath live using the online demo or check out few more additional videos. There are 1 brief one and another 2 that dive deeper in explaining and introducing the NetPath.
Network Performance Monitor Training: Netpath (5:11 min)
SolarWinds Lab #44 - NetPath (13:40 min)
Hacking the Internet with NetPath (37:44 min)